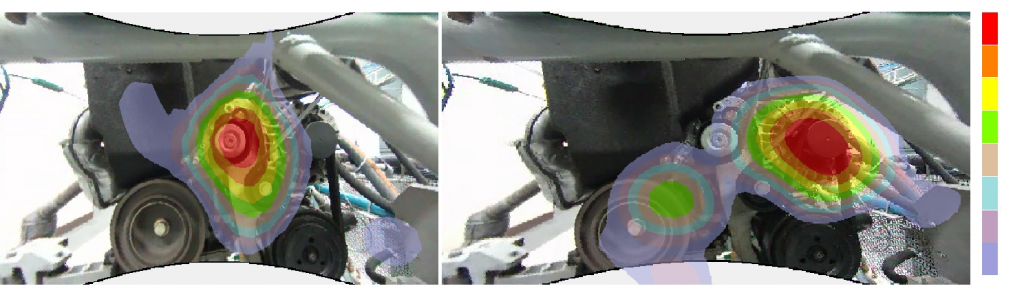
MicrodB’s techniques and tools can be adapted to any type of measurement environment. It is possible to pinpoint dominant sound sources, even on untreated benches with near-field measurements. The choice of array depends on the analysis frequency band and the measurement distance. Processing is adapted to the expected results.
Real-time analysis enables the first noise sources to be located and modifications can be tested and evaluated in a very short time, to reduce development and design costs.
In addition to locating acoustic sources, it is sometimes necessary to define or respond to specifications, or to re-align a simulation. On the measurement bench, ISO standards 3744 and 9614 enable the overall acoustic power of a product to be measured using an intensimetry probe. To go further and break down the power by component or sub-surface, MicrodB offers an innovative and advanced method of measuring the complete 3D acoustic field, with reconstruction on the object’s mesh using Bayesian focusing.
However, imaging techniques do not provide information on the original noise generation phenomenon, but rather on its emission. Source separation methods provide this additional information. They are also based on array measurements using microphones and, in the case of coherence methods, other reference sensors. The advantage is that source separation and location methods can be chained together to associate an acoustic emission with a physical phenomenon, and to display on the noise map only those sources that are coherent with a sensor or another source on the map, or vice versa by anti-coherence.